In technical analysis, candlestick patterns help investors read stock price movements visually and systematically. These patterns provide signals of potential price increases or decreases within a given period.
Through this article, you will learn how to read candlesticks charts so your trading decisions become more measured and data-driven. Let’s dive in!
What Is a Candlestick?
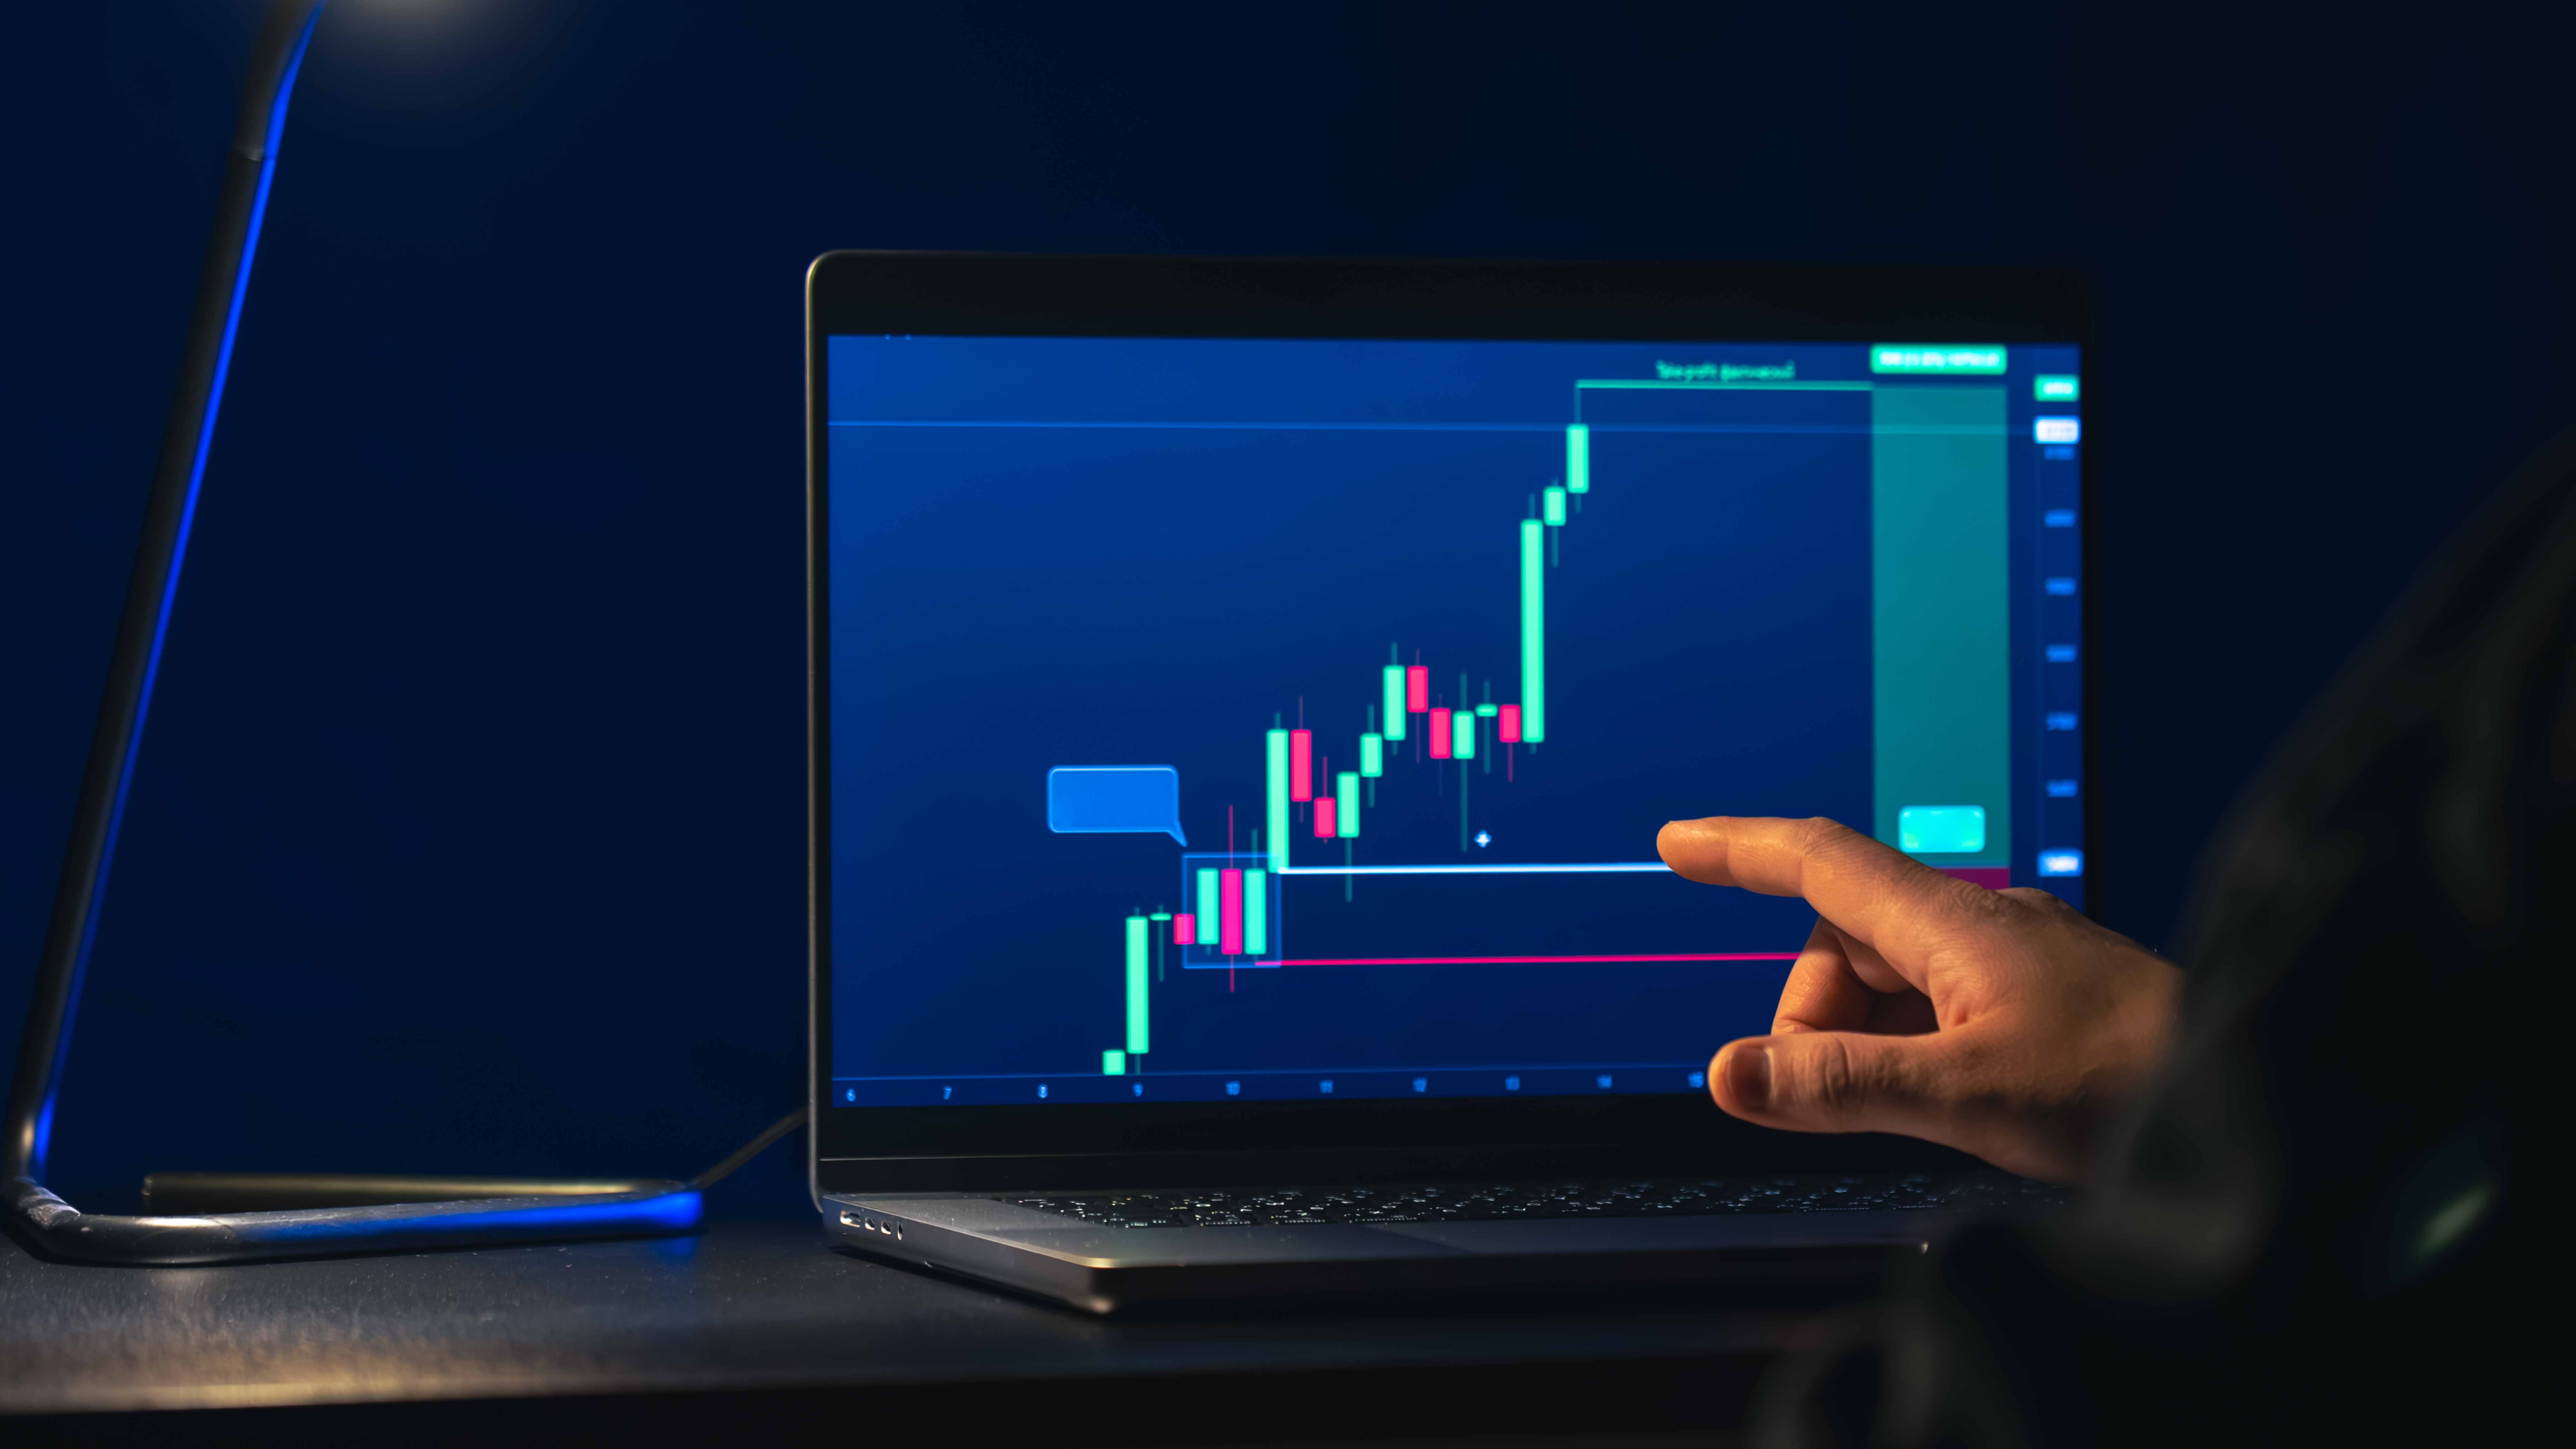
A candlestick is a chart type that displays stock price movements over a specific period. Each bar (candle) shows four key pieces of information: the opening price, closing price, highest price, and lowest price. This makes it easier for investors to identify emerging patterns.
This charting method originated in Japan and was initially used by rice traders to monitor price fluctuations. Today, investors use it to help determine potential future price movements.
Basic Structure of a Candlestick
Here are the key components of candlestick patterns that help you interpret price movements:
1. Body
The body represents the difference between the opening and closing prices. A long body indicates strong price movement during that period.
2. Upper Shadow
The upper shadow shows the highest price reached before the price moved back down. It reflects selling pressure.
3. Lower Shadow
The lower shadow shows the lowest price reached before the price rebounded. A long lower shadow often signals buying pressure.
4. Candle Color (Bullish & Bearish)
The candle’s color indicates price direction. A bullish candle (commonly green) means the closing price is higher than the opening price. A bearish candle (commonly red) means the closing price is lower than the opening price.
If a long green body forms with short shadows, buyers dominate the market. Conversely, a long red body suggests sellers are in control.
How to Read Candlesticks
To understand how to read candlesticks, recognize the meaning of each element:
|
Element |
Meaning |
Market Signal |
|
Green Candle (Bullish) |
Closing price is higher than opening price |
Stronger buying pressure |
|
Red Candle (Bearish) |
Closing price is lower than opening price |
Stronger selling pressure |
|
Long Body |
Large gap between open and close |
Strong momentum (buying or selling) |
|
Long Shadow |
Price moved far before reversing |
Battle between buyers and sellers |
Beyond color and length, pay attention to buying and selling pressure. A long green body with short shadows indicates buyer dominance. A long red body suggests sellers are pushing prices downward.
Popular Candlestick Patterns
After understanding the structure and basics of candlestick patterns, here are several popular patterns commonly used by beginner traders:
- Doji: A very small body where opening and closing prices are nearly the same. This pattern indicates market indecision.
- Hammer: A long lower shadow with a small body at the top. It typically appears after a price decline and may signal a potential upward reversal.
- Shooting Star: A long upper shadow with a small body at the bottom. It often appears after a price increase and may signal a potential downward reversal.
- Bullish Engulfing: A large green candle fully engulfs the previous red candle. This signals strong buying pressure and potential upward movement.
- Bearish Engulfing: A large red candle fully engulfs the previous green candle. This signals strong selling pressure and potential downward movement.
Tips for Using Candlesticks in Trading
To improve analytical accuracy, apply these strategies to ensure signals are relevant:
1. Don’t Rely on a Single Pattern
When learning how to read candlesticks, one pattern alone is not enough to make a decision. Consider the previous trend and wait for confirmation from the next candle for stronger validation.
2. Combine with Volume & Other Indicators
Use trading volume, moving averages, or the Relative Strength Index (RSI) to strengthen your analysis. If a pattern is supported by high volume, the signal is generally stronger.
3. Use a Timeframe That Matches Your Strategy
Adjust your timeframe to your trading style. Day traders typically use shorter timeframes, while medium-term investors analyze longer timeframes.
Master Candlesticks and Trade with Confidence
Learning how to read candlesticks helps investors analyze market direction more clearly. Instead of guessing price movements, you can make decisions based on measurable signals and structured analysis
For more practical insights, use the comprehensive charting features and technical indicators available on Growin’ by Mandiri Sekuritas. Monitor stock movements in real time and start trading with a more refined strategy today.


